Here’s what you will learn:
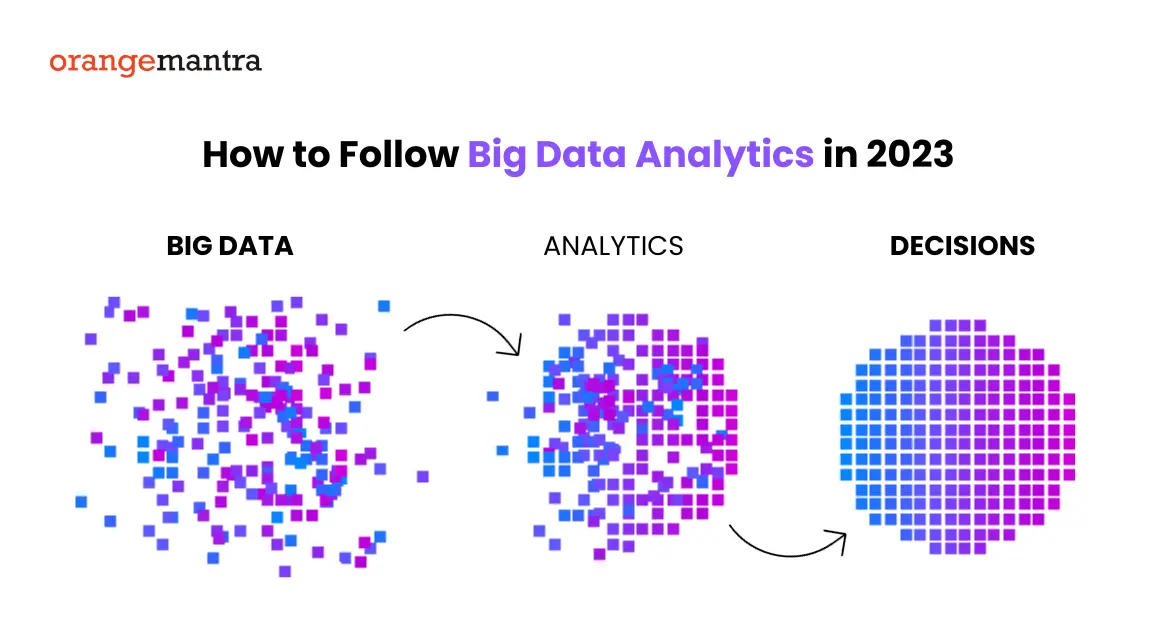
Have you ever wondered how businesses would have fared in data swamps? The globe generates massive amounts of data daily. So, big data analytics is the way to go for better analysis and visualization. Aside from results, analytics assists firms in making strategic decisions.
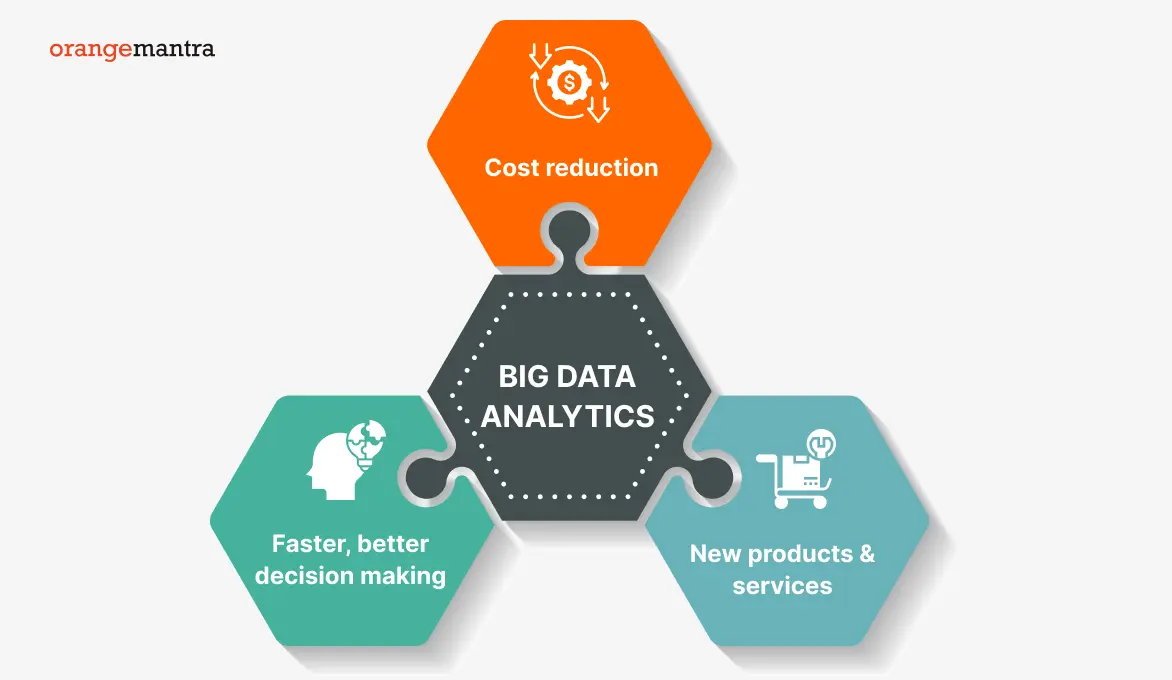
Furthermore, the point for cost reduction is perfectly on target. Do you want to learn more about the entire procedure? Keep reading!
Table of Contents
What is the need for big data analytics?
As the name suggests big data deals with large volumes of data. It has the complete process of studying trends, patterns, and other related data. Additionally, it filters organized and unstructured data in a comprehensive format.
So, users can make data-informed decisions from the unfiltered and raw data. There are many analytics that get into the process of analyzing the data. Big data analytics has created a strong buzz for a long time now. Firms adopting this tech trend helped to make future-ready solutions.
Even business intelligence and analytics tools like Hadoop and NoSQL also came for processing. However, this tech trend has a vast transformation to the present. Let’s have a look at the latest statistics
- The global Big Data and Analytics market is worth up to $274 billion.
- Healthcare industry Big Data analytics will reach $79.23 billion by 2028.
- Cloud computing user spending is around $500 billion.
Benefits of big data analytics for businesses
Here are the advantages of using big data for enterprises.
1- Risk management
Big data collects information from across time and place. So, when it has enough data to analyze trends can identify risks. Because it can help combat fraudulent operations. And the team can work together to achieve it. So that you can suspect and eradicate the root causes of the problems.
2- Product development
Not just small apps even airplanes can get big data for their development process. So that data engineers may quickly create an effective system for users. Big data analytics services help to gain previous data to create insightful decisions. Plus, you will get the solutions needed for the accurate results. Just like our services offered by IKEA with analytics-powered dashboards. And it helped them to analyze the data in a unified format.
3- Better decisions
Just like how different drink brands select seasonal drinks for the users. Such as Starbucks makes strategic winning decisions to gain more user engagement. Then it creates a specific drink for some location and gets limited to an outlet. So, this creates a business strategy that access the huge user retention. So, it will analyze population, demographics, location, etc.
4- Improved experience
Business intelligence and analytics help to improve user experience via insights. It helps to design user experience, journey, and other roadblocks. So, it identifies user data or the issues to find a suitable situation. Plus, it helps them address the issues and easily find the solution. So, it helps to build a stronger bond with users.
5- Customer retention
Gather user needs, behaviors, patterns, and preferences for a better digital solution. Firms use big data analytics services to gather user patterns and build tailored user needs. So, it ensures user loyalty, satisfaction, and sales boost. Tech giants like Flipkart and Amazon use big data to offer streamlined experiences. Plus, it helps to gather insights, previous purchases, and patterns to decide on products.
6- Focused promotions
Businesses help to offer personalized products to the market. When we implement big data analytics we get the hidden insights too. So, it allows you to carry campaigns that drive traffic and users. Enterprises can easily monitor their invested campaigns and user interests. You get the insights to target the audience as per user expectations and reputation.
7- Innovative ideas
You can easily get new ideas to implement via the analytics. Because it collects data in different formats and sources. And you can form new decisions based on collected data. So, when you uncover data and solve issues you can find innovative ideas easily. And you can mold the strategies as per your business needs. Even you can give a strong competition in the market.
8- Cost optimization
When you implement intelligent big data tools, it can help you in multiple ways. So, the benefit is you get the premium choice to store, process, and analyze. And when you use unified tools, you don’t have to find multiple tools. So, all your work is in one place. Plus, it optimizes the cost of spending on different tools.
Lifecycle of big data analytics
Just like other processes, data analytics also follows defined stages to offer data.
1- Data collection
When you talk of big data analytics, it means data of every kind. Take an example of any firm and its disparate data sources. So, it will collect structured and unstructured data. It can be from sources formerly associated with the firm. Or from the IoT devices, sensors, cloud, or other tech devices. Even data can be in warehouses, data lakes, or data swamps. And this is all for the seamless extraction of data.
2- Process data
After the successful data collection, we move to the processing part. Because how can you process disorganized and scattered data? So, this stage deals with organizing data in different categories as per needs. However, nowadays the expansion of data brings a headache to the firms.
But batch processing is here to the rescue! As it processes the large data blocks at once. It becomes the best choice if analyzing takes a lot of time. On the other hand, stream processing helps to process small sets of data. Even big data analytics focuses on shortening the delivery time and analysis in less time. However, looking at this comparison, the stream is quite expensive than batch processing.
3- Data filtration
Now that you have organized the data, it needs further cleaning. Because data of any size needs cleaning. It can be scrubbing to get the dirt off! Filtration of data takes place to eliminate any noisy data. And it removes repetitive data and incorrect data. Because duplicate or irrelevant data can disturb your results. Data that is not clear can’t offer clear results.
4- Analyze data
Business intelligence and analytics have all the useful data to make robust insights. So, when you get your data cleared, you jump straight to analyzing. Because now you get the filtered data that can help you deliver meaningful insights. So, here’s a quick look at the data analysis methods:
-
Data mining
It differentiates the large data as per patterns by identifying the discrepancy.
-
Predictive analytics
As the name goes, predictive analytics predicts insights based on historical data.
-
Deep learning
It uses AI and ML to identify patterns and offer insights.
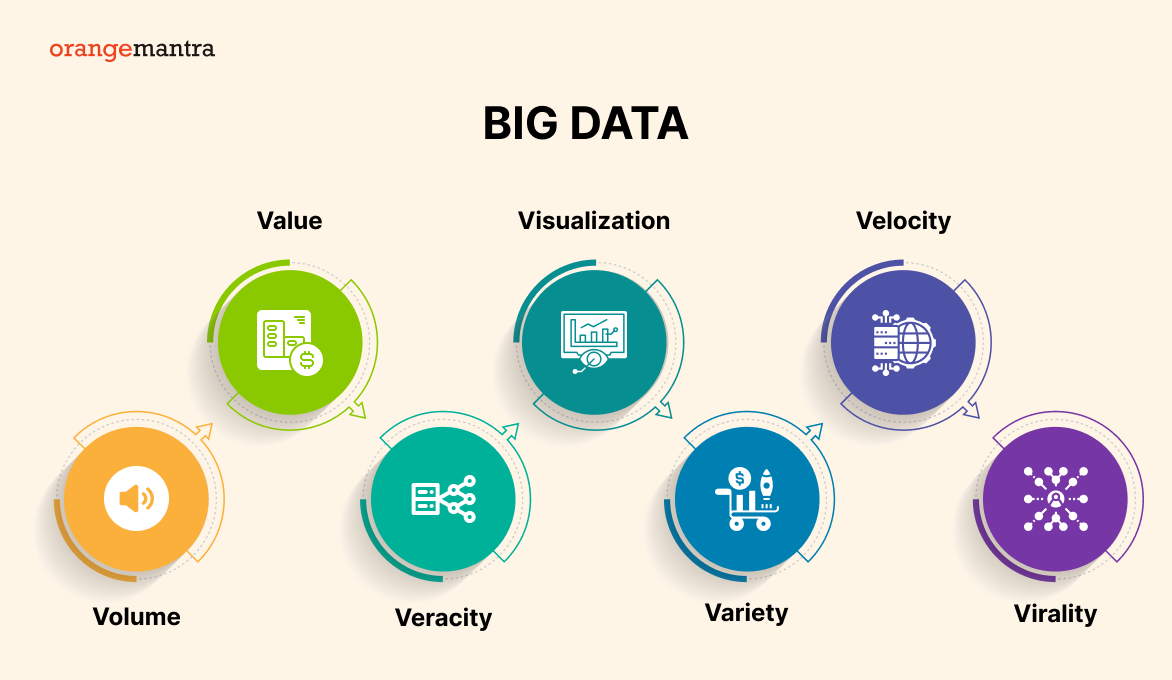
4 V’s of big data analytics
Here are the crucial four characteristics of big data analytics.
1- Volume
Firstly, we have volume. Big data directly depends on the volumes of data. Because it has more data than any other enterprise. So, the processing of such huge data helps to create new systems. However, the need for a large volume of data depends on the enterprise’s needs. However, the volumes of data depict different values to the systems. You can easily merge or increase the data.
2- Variety
Another crucial V of big data analytics is variety. Because as stated above the data comes from different sources. So, the data can contain many discrepancies. And even the data was not overridden before the storage. So, the new data sources can generate more data. So, the data variation counts every form of data and sources. It can be off social media, enterprises, or time-series data. Big data find it challenging sometimes to manage this variety of data.
3- Velocity
Business models count IoT data for analysis. And this data is in the continuous state of generation. So, it results in increasing the speed of data creation. And even if it’s true, data is not static. Because it keeps on changing and growing with time. Even is necessary to increase data creation. However, this may lead to storage issues later. But as mentioned above, batch processing can help you cut any extra time overheads. Even it can manage faster data generation efficiently.
4- Veracity
Now, we move to the accuracy of data. After following the lengthy process such a crucial data veracity remains questionable. Because data comes from different systems the accuracy of such data is challenging. Even the data recorded has different times, dates, and names. However, if we shift these specs, we can’t determine which data is for which purpose. So, it can lead to error-blessed data. And it becomes necessary to implement tools and strategies for veracity.
Tools and technology used for big data
Here are some big data analytics tools used that make the analytics process easier.
Quite a popular open-source framework. It stores and processes the big data in groups. Plus, it manages the structured and unstructured data for any operation.
NoSQL or non-relational DBMS that doesn’t have a theme. Or they don’t need one. However, they become the best option to filter raw data to handle a variety of data.
Another crucial framework for big data analytics services. It deals with two operations. First is mapping which filters various nodes. Secondly, it reduces and organizes the nodes answering the request.
It is known as ‘Yet Another Resource Negotiator.’ Also called second-generation Hadoop. Because it deals with cluster management. And it helps to easily schedule jobs as per resources.
Another cluster managing open-source framework. It implements data equality and issue elimination. Also, it offers an interface to program the complete clusters. Plus, it can manage both batch and stream processing. You can consult business intelligence consulting services for your assistance.
It’s an end-to-end analytics framework to design, analyze, and collaborate. Tableau easily offers self-service to users by asking questions and sharing insights.
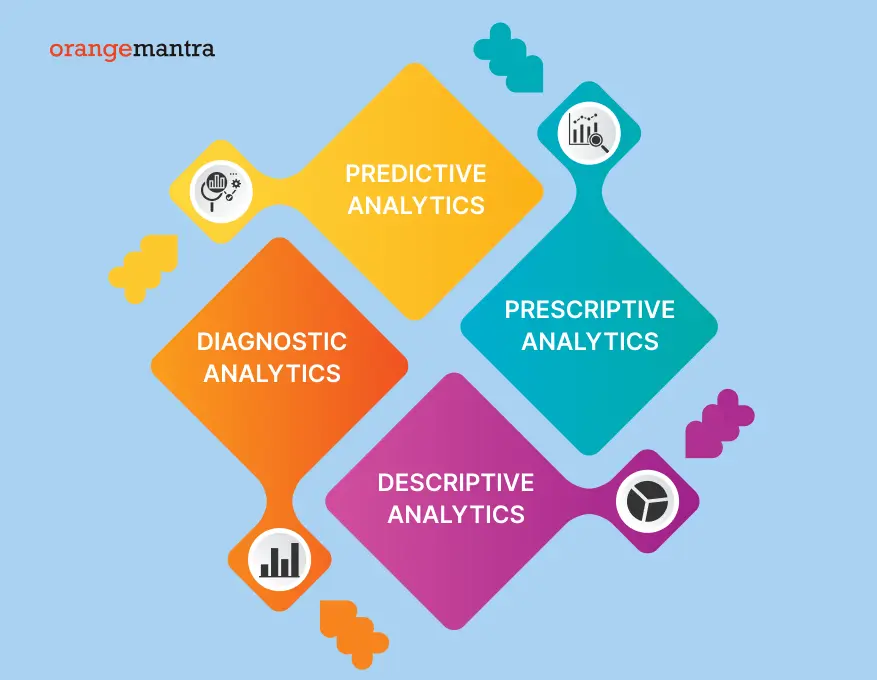
Categories of Big Data Analytics
Here are some common big data analytics types to know.
1- Prescriptive analytics
As the name suggests, it follows rules and regulations. The analytics you get in this follow a defined path. It has a simple procedure to follow. Gathering the previous data, work on neural networks. And then recommend the actions or insights for the results.
But have you ever thought about how to make these prescriptive data to automate decisions?
2- Diagnostic analytics
This type of big data analytics will go in-depth to know certain answers. Such as why and what of the data. It is popularly known as behavior analytics. Enterprises use it to find certain answers like why did iPhone sales go higher this year? So, for this analytics would dive into the past data to study the behavior. Then it will generate the results from the user’s perspective. So, this goes into the dashboard implementation.
The benefits of these analytics are
- additional data limit blind spots
- questions help to deliver accurate results
Overall, this type helps to go deep in the research to find suitable answers.
3- Predictive analytics
So, this analytics type helps to forecast future trends. Big data is all about collecting previous data and generating results. Particularly this type deals more with this concept. It unveils the how and why of the questions. And answer it via the predictions. But it’s all dependent on diagnostics analytics. But why? Because diagnostics analytics has all the uncovered data patterns. So, Machine Learning development company helps to study and predict what is going to occur.
4- Descriptive analytics
Last, but not least. Descriptive analytics deals with the explanation of data and results. It studies all the data collected to transfer analytics with a description. So, it easily comprehends the data to the end users. Business uses this analytics type to generate descriptive results. And it implements the information in the generation for valuable insights. Plus, to get high performance.
Conclusion:
Big data analytics offers a huge help to simplify the results for enterprises. However, all you need is the correct tools and processes. And all the data mentioned above can help you with a better move. For more consideration, consult AI development company for your project.
FAQs
-
What factors influence big data analytics?
The variables are the storage factor, the processing factor, the security factor, and the quality factor. These variables are referred to as independent variables, while big data analytics is regarded as a dependent variable in this study.
-
What are the most important factors for big data analytics success?
Data sources must be relevant to avoid duplicates and irrelevant findings.
-
What role does big data play in big data analytics?
Big data analytics is significant because it allows organizations to use massive amounts of data in many forms from various sources to detect possibilities and hazards, allowing them to move swiftly and improve their bottom lines.
Related Articles